Have you ever watched a sports scoreboard and thought it might predict market moves? A global market index works in a similar way. It keeps track of stocks from around the world, showing both daily changes and long-term trends. Think of it like a quick glance at how investor moods shift, similar to checking a game score during an exciting match.
In this post, we explain how the index is built and why its trends are sparking interest among market watchers. We offer straightforward insights into what could be coming next.
Global Market Index Overview and Definition
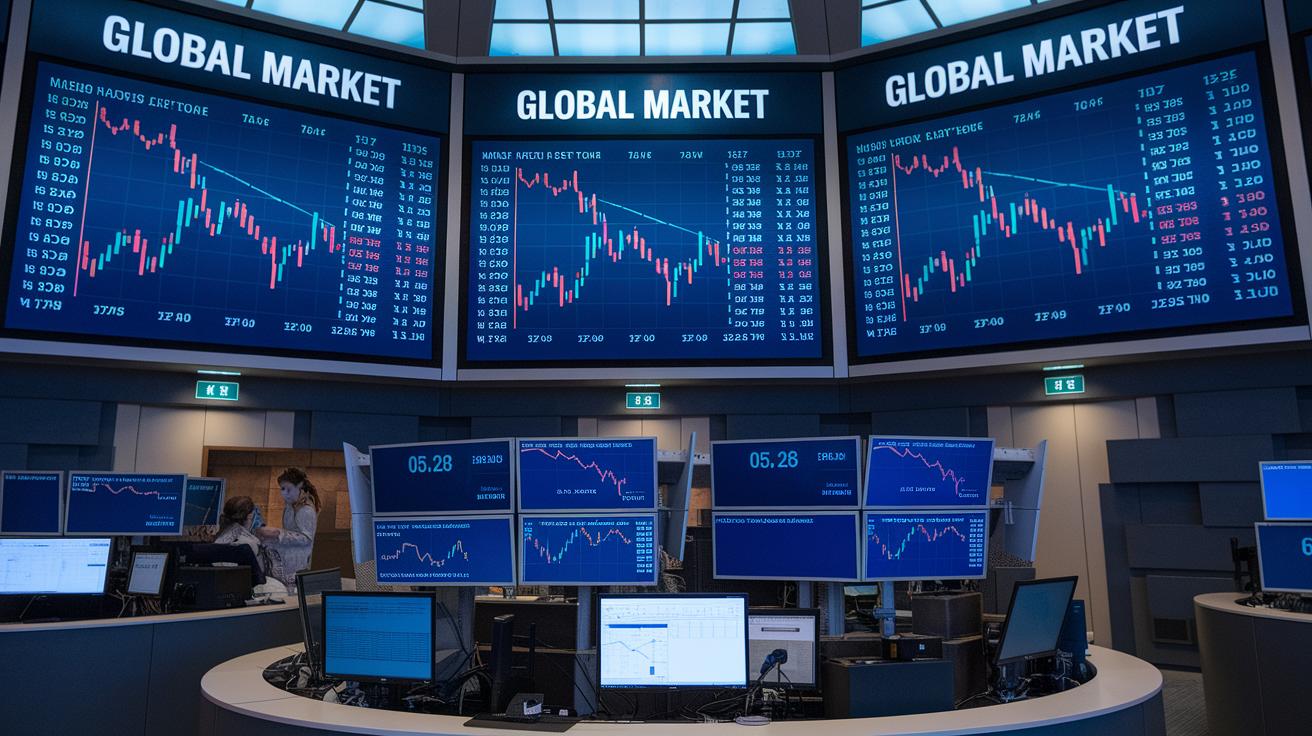
A global market index is a tool that shows how a group of stocks is doing in one market or even several markets at once. Think of it like a sports scoreboard, giving you a quick look at the mood of investors and the energy in the market.
This index tracks important numbers like daily percentage changes, year-to-date performance, and long-term growth trends over five or ten years. Daily percentage changes give you a snapshot of how the market reacts right away to news or events. Year-to-date performance shows how things have been going since the start of the year, and long-term trends help you see the steady climb or ups and downs over time. On some days, a global market index can swing several percentage points, sparking debates among market watchers about why these shifts happen.
Investors, analysts, and students all check these indices to see how their own investments stack up against the broader market. They use this information to decide where to put their money and manage risks. By keeping an eye on these clear, measurable signs, anyone can get a better feel for market changes and adjust their plans to benefit from growth while staying safe during downturns.
Global Market Index Construction and Weighting Methodologies

When you're looking at market indexes, the way stocks are weighted can really change how the index moves. The method used tells you how much each stock matters when the market shifts.
Market Capitalization-Weighted
This approach looks at each company's total market value. Big companies count more, so when one of them changes, the index can swing quickly. It’s like watching a big ship change course, the giants steer the whole market boat.
Price-Weighted
Here, the weight comes from the stock’s actual price. That means higher-priced stocks pull more weight. The Dow Jones Industrial Average works this way. Even if companies vary a lot in size, the stock price is the main factor driving the index.
Equal-Weighted
With the equal-weighted method, every stock gets the same say, no matter how big or small. This way, a tiny company matters just as much as a giant one. It evens out the influence, though it might not perfectly mirror the real market value.
| Methodology | Description | Example Index |
|---|---|---|
| Market Capitalization-Weighted | Weights based on a company’s total market value; bigger companies have a stronger impact. | S&P 500 |
| Price-Weighted | Weights determined by stock price; high-priced stocks have more influence. | Dow Jones Industrial Average |
| Equal-Weighted | Gives each stock the same weight; provides equal footing for small and large companies. | Equal-Weighted ETF |
Historical Performance Trends of Global Market Indices
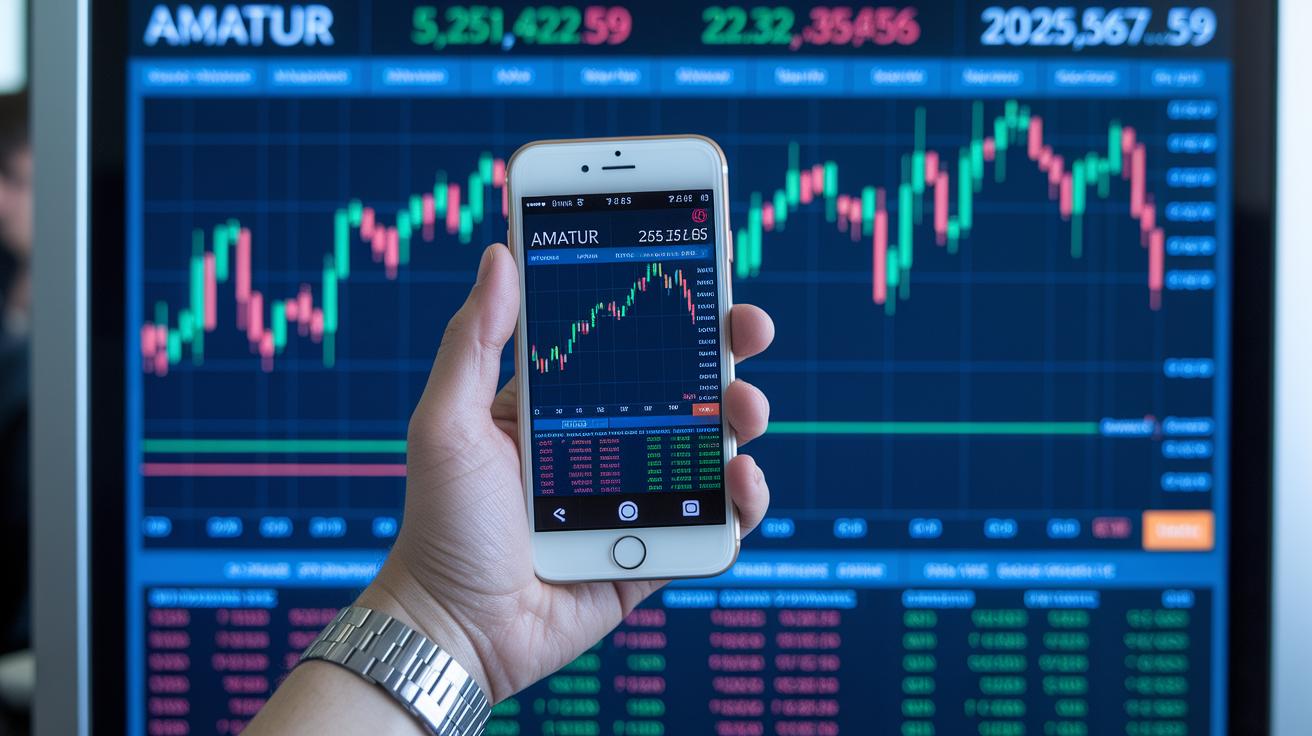
Global market indices have a history of acting in their own unique way, each telling a story about the economy at that time. Take the 2008 recession, for example. While many expected a total collapse, some indices bounced back quickly, showing that stronger companies and smart government moves can make a big difference. Studies have found that markets react differently when inflation is low compared to deep recessions. This clear difference gives us clues about what might happen next. A fun fact to share: during 2008-2009, as many braced for disaster, some indices turned uncertainty into growth by bouncing back with real energy.
Looking at how the market behaves during steady times versus wild swings gives us great real-life case studies. Charts and graphs, for example, reveal how investor mood and policy changes can steer performance in different directions. All this historical data helps us understand economic trends better, offering investors simple lessons to fine-tune their strategies based on past events.
- Daily percentage change
- Year-to-date return
- Five-year total return
- Ten-year total return
Investors use these numbers to compare different market cycles and see the big picture. By keeping an eye on day-to-day shifts alongside long-term trends, they can spot both quick turns and steady recovery phases. This clear, step-by-step look at market history helps them adjust their portfolios to balance risk and be ready for what comes next.
Regional Global Market Index Comparisons

The global market is like a vibrant mix of flavors, with each region offering its own performance cues to help investors get a feel for current trends. Today, we'll take a friendly look at what makes North America, Europe, and Asia-Pacific unique when it comes to market behavior.
North America Indices
In North America, indices shine because of strong tech and financial sectors. Big firms often lead the way, much like a relay race where the fastest runner sets the pace. When a major tech company posts good quarterly results, the whole index can get a boost. This trend shows up in everyday market numbers and highlights how sector mix and the size of companies can steer overall performance.
Europe Indices
The European market tends to focus on stable industrial and consumer sectors, with a steady dividend yield to boot. Think of it as a well-tuned engine keeping your car cruising smoothly. Investors appreciate this balance of low volatility paired with steady economic growth. For example, strong manufacturing numbers mixed with resilient consumer spending usually support these markets even when the economy shifts.
Asia-Pacific Indices
Asia-Pacific markets offer a different story with emerging market cues and episodes of high growth. These indices can deliver big gains, but they come with higher risks, kind of like riding a roller coaster that throws you a surprise every now and then. The MSCI Emerging Markets Index is a great example, showcasing the performance of new economies in the region. Here, the Shanghai Composite often leads the pack, while other indices may show softer trends, reflecting the diverse and ever-changing market environment in Asia-Pacific.
Investment Implications and Portfolio Strategies with Global Market Indices
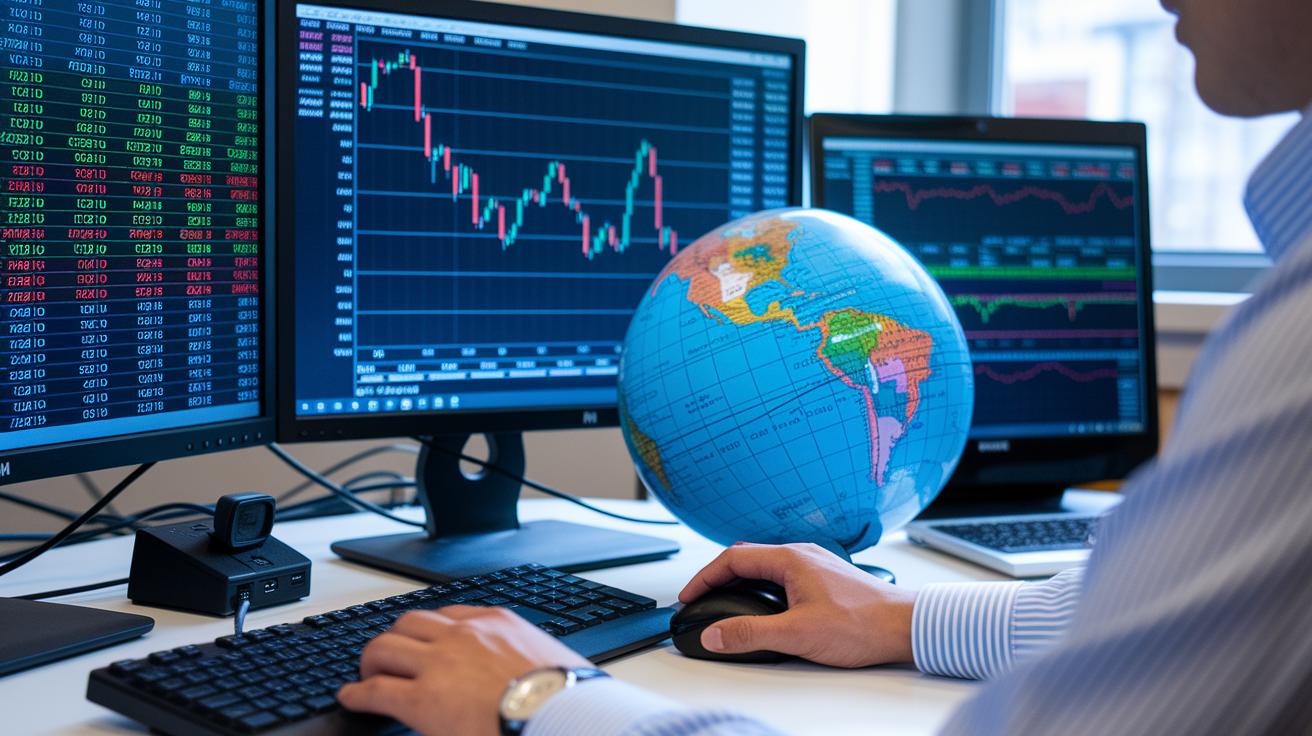
Investors often lean on global market indices when putting together a balanced portfolio. It’s like checking one dashboard to get a quick snapshot of how a wide slice of the market is doing. Each little bump or dip shows the combined heartbeat of many stocks, so you get a real-time view without digging into every single one.
A lot of people go for a laid-back approach with index funds and ETFs. These investment tools are set up to follow big market benchmarks, so you don’t have to stress about picking individual stocks. They make it simple to build a diverse, international portfolio by spreading your money across many sectors and regions. This straightforward strategy is popular because it’s both simple and cost-effective.
Global market indices also act like a guide for where to put your money and when to make changes. Investors use them to figure out if they’re too heavy in one part of the market or if some areas need a boost. It’s kind of like using a map when planning a road trip, you see the trends and adjust your route to stay on track with your financial goals.
Keeping risks in check is a big deal for a strong portfolio. Watching index trends helps investors know when to rebalance and protect against market downturns. Tools like What Is Risk Assessment let you see how indices behave in different parts of the economic cycle. By tuning into these signals, you can ease the bumps along the way and keep your investments steady and well-diversified.
Tools for Real-Time Global Market Index Tracking and Analysis
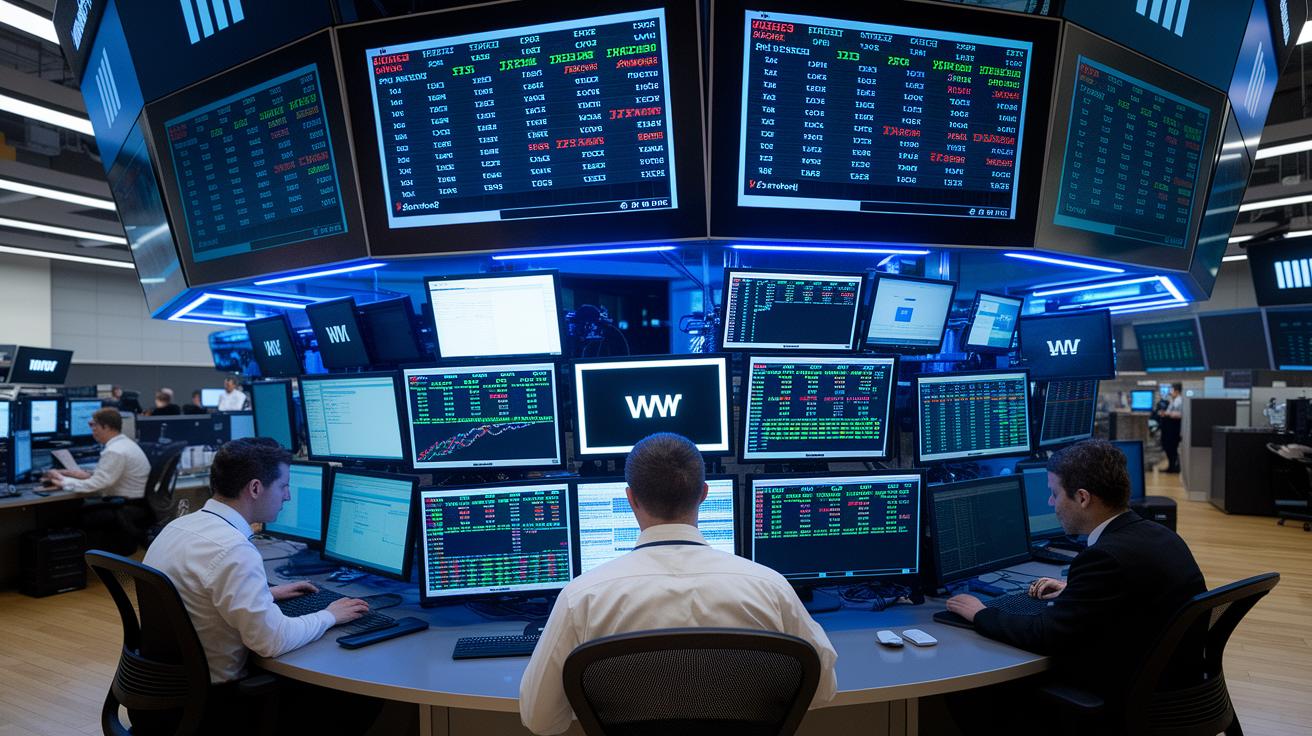
Real-time feeds let traders watch market changes as they happen. It’s like having a live snapshot of the market’s energy right at your fingertips. By looking at up-to-date data, investors can quickly spot shifts in sentiment and adjust their strategies without waiting for yesterday’s numbers.
Interactive dashboards are a key player in this process. They mix live index readings with historical charts in a clear, easy-to-read format. Imagine a screen that updates like a live sports score, making it simple to detect turning trends. Tools like the Trading Tools help by giving you a dynamic view of market charts from all over the world.
Alerts and API access add even more power to real-time tracking. These features send notifications when important changes occur, so traders don’t miss a beat. You can set up alerts to keep an eye on volatility and shifts in market mood. Platforms like Current Market Trends ensure you receive a steady stream of news, helping you make smarter, informed decisions in an ever-changing financial landscape.
Final Words
In the action, the article brings clarity to global market indices. It explains what a global market index is, covers various construction methods like market capitalization-weighted, and reviews historical performance and regional differences.
Short insights highlighted trends in portfolio strategies and real-time tracking tools. The discussion on the global market index offers smart investing guidance and long-term financial security tips.
The practical breakdown helps you feel ready to face market movements. Stay positive and use these insights to confidently manage your financial future.
FAQ
How can I access world market index live data?
The world market index live data means you see real-time stock index values. You can check financial websites or trading dashboards for instant updates on global market performance.
How do I get the latest global market news?
Global market news means receiving updates about stock trends and economic events worldwide. You can follow trusted financial news platforms or set up alerts on your investment apps.
What does global stock market information include?
Global stock market information includes current stock prices, trading volumes, and broader index movements. This data helps investors understand trends and make informed portfolio choices.
What do Dow Jones futures represent?
Dow Jones futures provide an early look at the expected direction of the Dow Jones Industrial Average before market hours. They help traders assess sentiment and potential market openings.
Where can I find a stock index list and MSCI World Index details?
A stock index list compiles various market benchmarks, including the MSCI World Index which tracks large and mid-cap stocks globally. Financial sites offer regularly updated lists and detailed index summaries.
Is September 8, 2025 a holiday for the stock market?
Stock market holidays depend on the exchange’s official calendar. Always check the specific exchange calendar to see if September 8, 2025, is designated as a trading holiday.
What is the global market today and current index reading?
The global market today reflects the most current readings of key market indices. Financial tools and news sites provide real-time data to help investors track these numbers as they change.
What are the three main market indexes?
The three main market indexes typically include benchmarks like the Dow Jones Industrial Average, the S&P 500, and the Nasdaq Composite, each representing different segments of the broader equity market.
